Technical analysis is a method of evaluating market behavior using historical price data, chart patterns, and indicators. Unlike fundamental analysis, which looks at economic reports and company performance, technical analysis focuses purely on price movement and volume to forecast potential market direction.
At its core, technical analysis is built on the belief that all known information is already reflected in the price. Traders use this information to identify patterns, spot opportunities, and determine the best entry and exit points. It doesn't aim to predict the future with certainty, but rather to improve the odds of making informed decisions by studying how the market has behaved in the past.
This approach is widely used across different markets—from forex and stocks to commodities and crypto—because it offers a visual and data-driven way to understand market trends, momentum, and sentiment. Whether analyzing a five-minute chart or a monthly timeframe, the principles remain the same. Understanding these basics lays the foundation for becoming a more disciplined and strategic trader.
Understanding Price Charts
Price charts are the visual foundation of technical analysis. They display the historical movement of an asset's price over time, allowing traders to observe market behavior and make decisions based on patterns and trends. The most commonly used chart types are line charts, bar charts, and candlestick charts—with candlesticks being the most popular due to the detailed information they present.
Candlestick charts, in particular, show four key pieces of data for each time period: the opening price, closing price, high, and low. This format gives traders a quick sense of market sentiment within a single candle and across larger trends. The shape and color of each candle also help identify potential reversals or continuation patterns.
Beyond just looking at price movement, traders often zoom in and out of different timeframes to get a broader or more detailed perspective. Shorter timeframes (like 5-minute or 15-minute charts) are useful for day traders, while longer ones (such as daily or weekly charts) help swing and position traders evaluate bigger picture trends. Being able to interpret chart data accurately is a vital first step in developing a solid trading approach.
Key Technical Indicators
Technical indicators are mathematical calculations based on price, volume, or open interest that help traders interpret market conditions and forecast future price movements. While there are many types of indicators, most fall into two categories: trend-following indicators and momentum indicators.
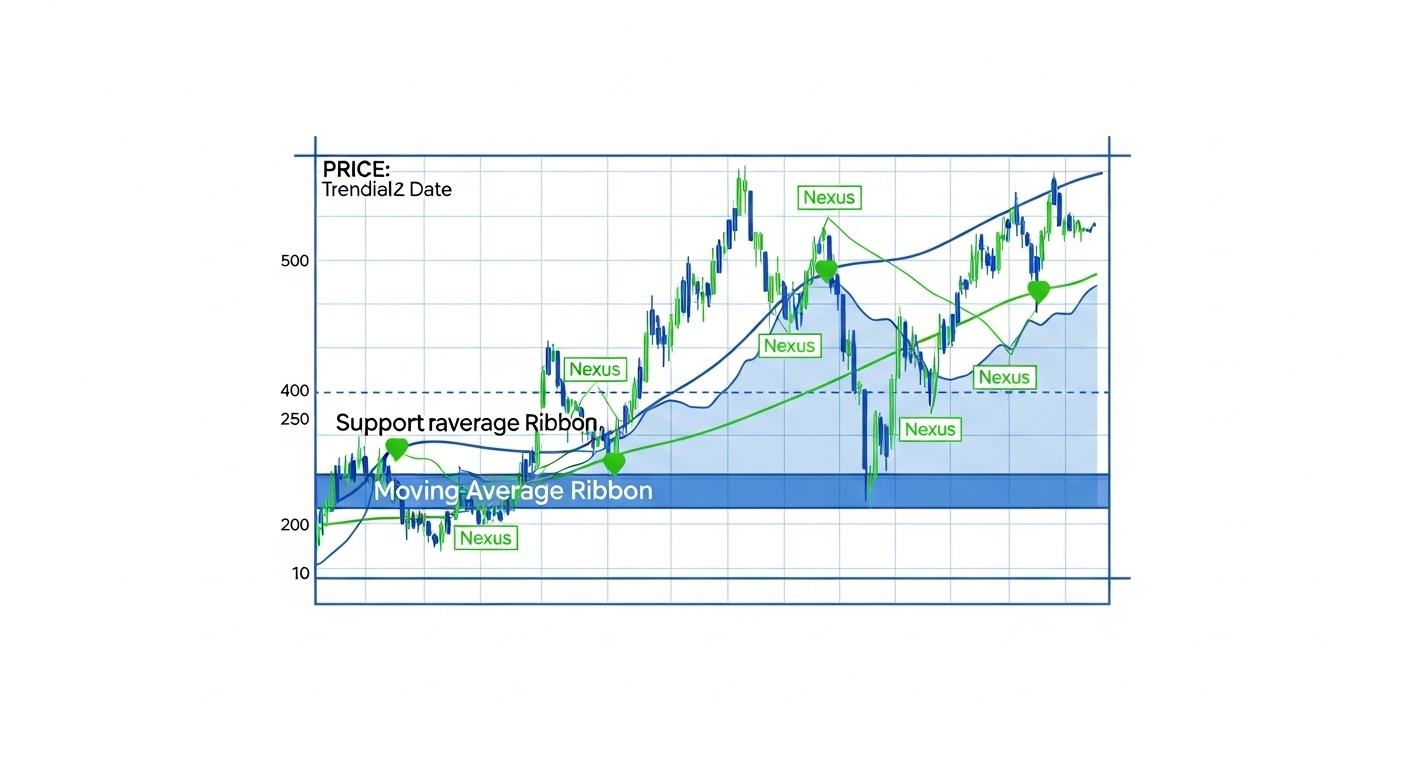
Trend-following indicators like Moving Averages (SMA/EMA) smooth out price data to help identify the direction of the market over time. These indicators are useful in filtering out noise and confirming whether the market is trending or ranging. For example, a crossover between short-term and long-term moving averages may suggest a change in market direction.
Momentum indicators such as the Relative Strength Index (RSI) and Moving Average Convergence Divergence (MACD) measure the speed of price movements. They help detect overbought or oversold conditions, potential reversals, and the strength of a current trend. When used alongside trend indicators, they can offer timely signals for entries and exits.
It’s important not to overload a chart with too many indicators. Most traders rely on a handful of trusted tools that complement their strategy. The key is understanding what each indicator measures and how it aligns with your trading goals. By combining multiple indicators thoughtfully, traders can gain a clearer picture of the market’s next potential move.
Identifying Chart Patterns
Chart patterns are essential tools in technical analysis. By studying how price movements form recognizable shapes, traders gain insight into potential future moves. These patterns typically fall into two categories: reversal patterns and continuation patterns.
Reversal Patterns
These patterns suggest a potential change in the current trend direction. They usually appear after extended price movements.
Head and Shoulders
This pattern signals a trend reversal from bullish to bearish. It features three peaks, with the middle peak (the “head”) being the highest. A break below the neckline confirms the reversal.
Double Top and Double Bottom
A Double Top forms after a strong upward move, showing two failed attempts to break a resistance level, signaling a bearish reversal. The Double Bottom is its bullish counterpart, appearing after a downtrend and indicating a potential shift upward after two failed breakdowns.
Continuation Patterns
Continuation patterns imply that the existing trend is likely to continue after a period of consolidation.
Flags and Pennants
Flags appear as small rectangles sloping against the prevailing trend, while pennants look like small symmetrical triangles. Both usually form after sharp price moves and suggest a continuation in the same direction once the pattern breaks.
Triangles (Ascending, Descending, Symmetrical)
These patterns show tightening price action and are often continuation signals. Ascending triangles typically break upward, descending triangles break downward, and symmetrical triangles can go either way depending on the breakout direction.
Understanding Price Action and Trends
Price action refers to the movement of a security’s price plotted over time. It reflects the real-time sentiment of the market and forms the foundation for most technical analysis strategies. Learning to interpret price action helps traders spot entry and exit points with greater clarity.
The Structure of Trends
Markets generally move in trends: upward (bullish), downward (bearish), or sideways (range-bound). An uptrend consists of higher highs and higher lows, while a downtrend shows lower highs and lower lows. Recognizing these patterns early allows traders to align their positions with the prevailing momentum.
Support and Resistance
Support is a price level where demand is strong enough to prevent further declines, while resistance is where selling pressure tends to cap upward movement. These levels often become self-fulfilling as traders use them to set entry points, stop losses, and take profits. The more times a level is tested without breaking, the stronger it becomes.
Breakouts and Retests
When price breaks through established support or resistance, it often signals a significant shift. A breakout accompanied by volume can lead to strong moves. Retests occur when price moves back to test the broken level, offering potential entry opportunities with more confirmation.
Using Technical Indicators
Understanding how to apply technical indicators in real trading scenarios is key to turning analysis into actionable decisions. Each indicator serves a distinct purpose—some highlight the trend, others confirm momentum or signal potential reversals.
Moving Averages and MACD
Moving Averages (MA), such as the Simple Moving Average (SMA) and Exponential Moving Average (EMA), help smooth out price data and reveal the underlying trend. Shorter periods like the 20-day EMA respond faster to price changes, while longer periods like the 200-day SMA give a broader view.
The MACD (Moving Average Convergence Divergence) builds on this by tracking the relationship between two EMAs. Its histogram and signal line can help identify bullish or bearish momentum, making it useful for spotting trend continuation or possible reversals.
RSI, Stochastic, and Momentum Indicators
The Relative Strength Index (RSI) and Stochastic Oscillator are both momentum indicators, but they work slightly differently. RSI tracks the magnitude of recent price changes to indicate overbought (typically above 70) or oversold (below 30) conditions. Stochastic compares a particular closing price to its price range over a period of time and is more sensitive to price changes.
These tools help traders identify entry and exit points by highlighting when a trend may be losing strength or preparing to reverse.
Volume-Based Indicators and Their Role
Volume gives insight into the strength behind a move. For example, a price breakout backed by high volume is more likely to hold than one with little activity. On-Balance Volume (OBV) and Volume Oscillator track buying and selling pressure, helping traders confirm the validity of a trend or potential reversal. When volume aligns with price movement, it reinforces confidence in the signal.
Combining Indicators and Patterns
Using multiple tools to support a trading decision can strengthen your strategy—if done correctly. But layering too many indicators can clutter your charts and create confusion instead of clarity. The key is balance and structure.
Avoiding Indicator Overload
Too many indicators can send mixed signals and delay decision-making. Sticking with a few well-understood tools helps maintain focus. For example, combining one trend indicator, one momentum tool, and one volume-based signal often provides enough insight without adding noise.
Finding Confluence Between Tools
Confluence occurs when different indicators or patterns point to the same outcome. If a bullish flag pattern aligns with an RSI reading near 40 and a MACD crossover, the case for a long entry becomes stronger. Looking for agreement among tools helps filter out weak or false setups.
Building a Structured Approach to Analysis
Every chart review should follow a sequence. Start with the trend, look for patterns, check key support and resistance zones, and then apply indicators for confirmation. Having a repeatable method makes technical analysis more objective and consistent—two traits that are essential for long-term success.
Practice and Continuous Improvement
Becoming proficient in technical analysis isn’t about finding a single perfect setup—it’s about refining your skills through repetition, review, and adaptability. Every successful trader evolves with the market by practicing, tracking performance, and learning from experience.
Backtesting Strategies
Before using a strategy in live markets, it's smart to test it against historical data. Backtesting helps you see how your approach would have performed during different market conditions. It builds confidence in the system and reveals weaknesses that need adjusting.
Keeping a Trading Journal
A detailed trading journal is one of the most underrated tools in a trader’s arsenal. Recording your trades—including the setup, reasoning, outcome, and emotion at the time—helps identify recurring mistakes and strengths. Over time, this documentation becomes the blueprint for improvement.
Adapting to Market Changes Over Time
Markets change. What works in a trending environment might fail during consolidation. Regularly reviewing your strategies, tweaking indicator settings, and learning new techniques keeps your trading process sharp. The ability to adapt is what separates consistent traders from the rest.
Conclusion
Mastering technical analysis isn’t about predicting the market with absolute certainty—it’s about increasing the odds in your favor. By understanding chart patterns, applying indicators correctly, and following structured methods, traders can make informed decisions with greater confidence.
Continuous practice, journaling, and adapting to different market conditions are key to staying consistent. Like any skill, technical analysis sharpens over time, and those willing to learn and evolve are the ones who thrive.
Use this guide as your foundation, but keep studying, testing, and refining. The market rewards discipline, preparation, and patience.